The Paradox of Kickers and Defenses: Undervalued, Yet Still Overrated
Lessons Learned


Bottom Line Up Front
Not many fantasy managers like to spend much time thinking about kickers and defenses, and it turns out that pays off if they wait till the end of their drafts to fill those roster spots.
In my 2024 data, both positions were defined by unpredictability. Rank correlations between preseason expectations and actual results hovered just above noise. For kickers, ADP was essentially zero, and projections barely moved the needle. Defenses weren’t any better, with “can’t-miss” teams flopping and bottom-ranked ones soaring into the top tier. If you think you can forecast these spots with confidence, the numbers say you’re spinning a roulette wheel.
Double-digit rank errors were the norm. Taking the first kicker over the twelfth rarely changed outcomes. Drafting a “top” defense often meant paying extra for a logo. Even the tiny hints, like field-goal attempts for kickers or opponent points allowed for defenses, were too weak to rely on across a season.
The takeaways are simple: 1/ Don’t spend meaningful draft capital on either position in standard scoring; final two rounds are fine. 2/ Be aggressive with waiver moves once the season starts to take advantage of favorable matchups and/or conditions. 3/ For kickers, target dome games and teams that create attempts. 4/ For defenses, chase matchups against turnover-prone offenses and weak offensive lines.
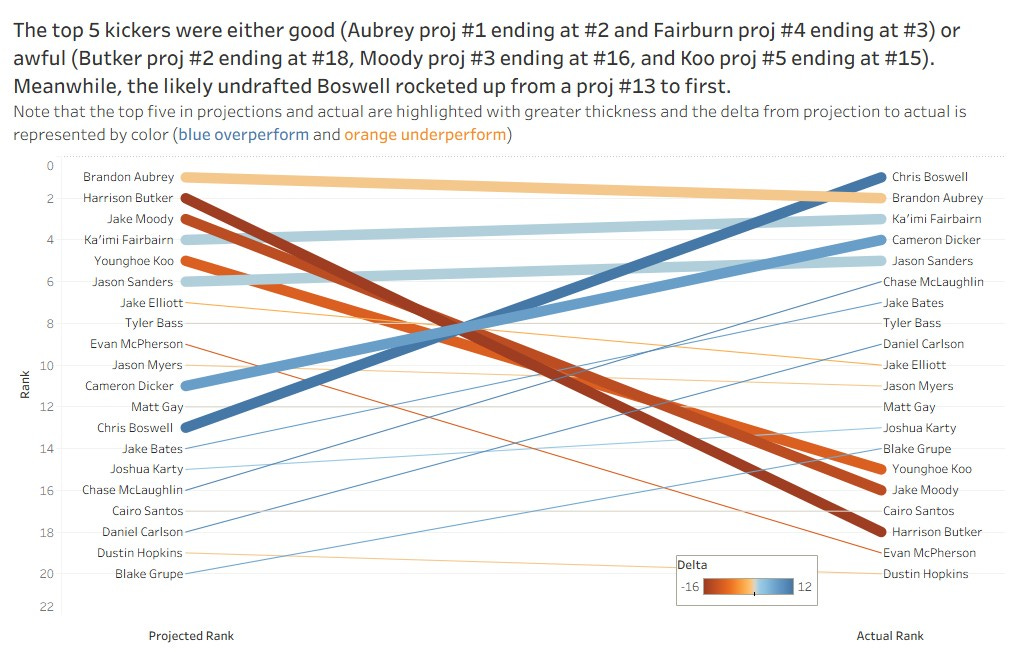
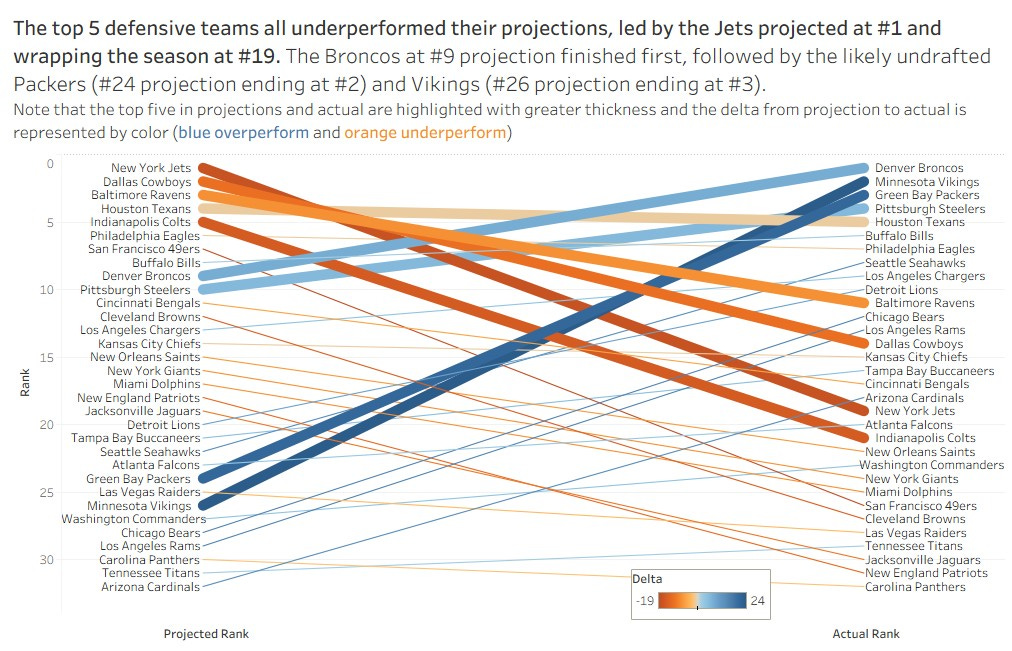
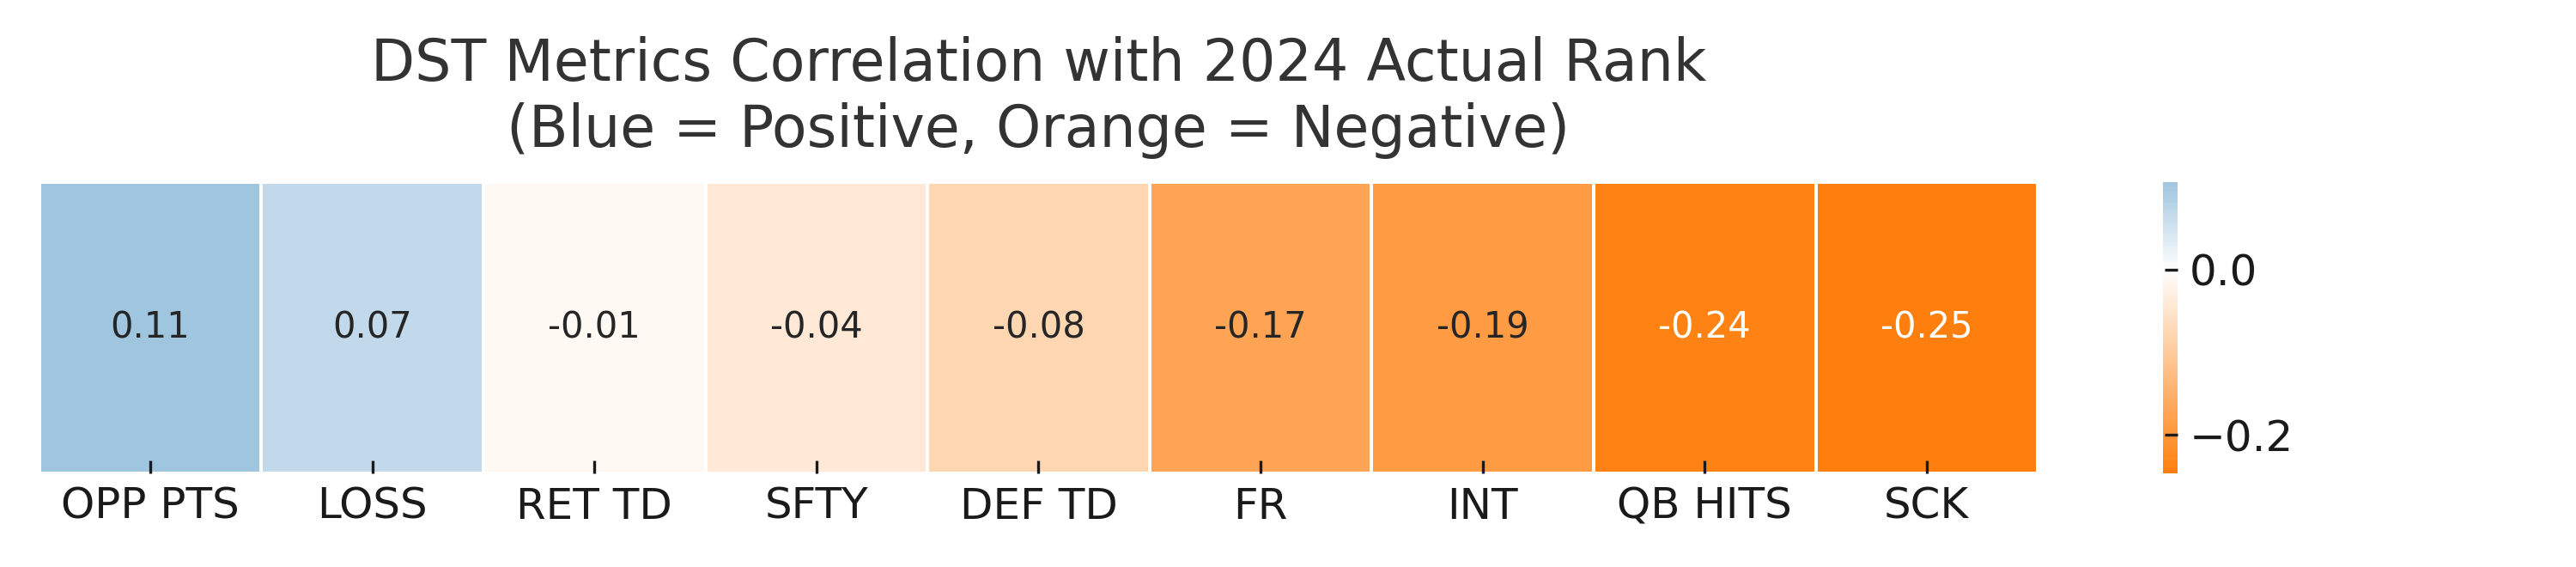
Figures 1 and 2 show slope graphs for kickers and defenses, comparing “expert” preseason projections to year-end reality. And yes, I call them “experts” with a nod to Argo: “This is the best bad idea we have.”
How Bad Are They Really?
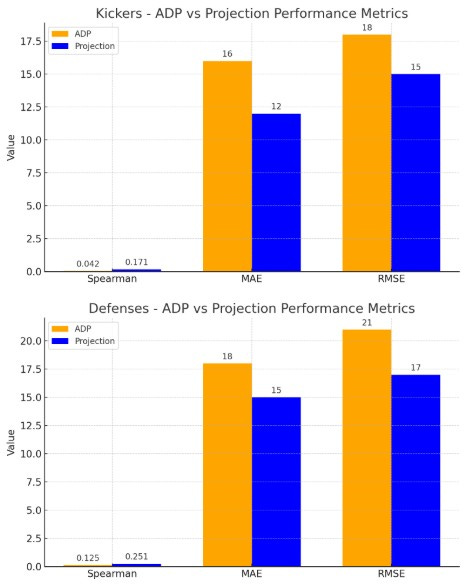
When I talk about accuracy here, I’m looking at three main tests. Spearman correlation measures the strength of the relationship between preseason ranks (either ADP or projections) and actual season finishes. A perfect 1.0 means you nailed the order exactly, while a 0 means there’s no relationship at all, pure randomness. Mean Absolute Error (MAE) tells you, on average, how many ranking spots the predictions missed by, while Root Mean Square Error (RMSE) does the same but weighs larger misses more heavily. For context, a solid predictive model in fantasy football for skill positions might show Spearman values well above 0.6, with MAE in the single digits.
Kickers were a dumpster fire. The rank relationship between what we thought would happen and what actually happened was barely there: Spearman was 0.042 for ADP and just 0.171 for projections. That’s noise-level weak. The errors weren’t pretty either. The average miss came out to roughly 16 spots for ADP and 12 spots for projections (MAE), with bigger whiffs punished up to 18 and 15, respectively (RMSE). In practical terms, drafting the top kicker by ADP or projections didn’t buy you much certainty over waiting and taking a middle-of-the-pack option.
Defenses were worse. Well, perhaps that's not technically accurate. Spearman limped in at 0.125 for ADP and 0.251 for projections, which is a hair above kickers. It is still weak, still unreliable. The miss sizes told the same story: MAE around 18 for ADP and 15 for projections, and RMSE roughly 21 vs 17. And the outcomes were absurd: teams projected in the 20s finished top-three while a few preseason darlings cratered. If you drafted one of these "top" defenses early, the season punished you for it.
The deeper issue is the volatility hiding inside these averages. A handful of “hits” create the illusion that you can nail these picks, but the misses are so frequent and so severe that they erase any edge you thought you had. Even if you hit on a top kicker, the positional scoring spread is usually small enough that it barely moves the needle in your weekly matchups. For defenses, the gap between a top-five finish and a waiver-wire streamer is often just one or two lucky games with defensive touchdowns, which are completely unpredictable. In other words, the juice just isn’t worth the squeeze.
Looking for Predictive Clues
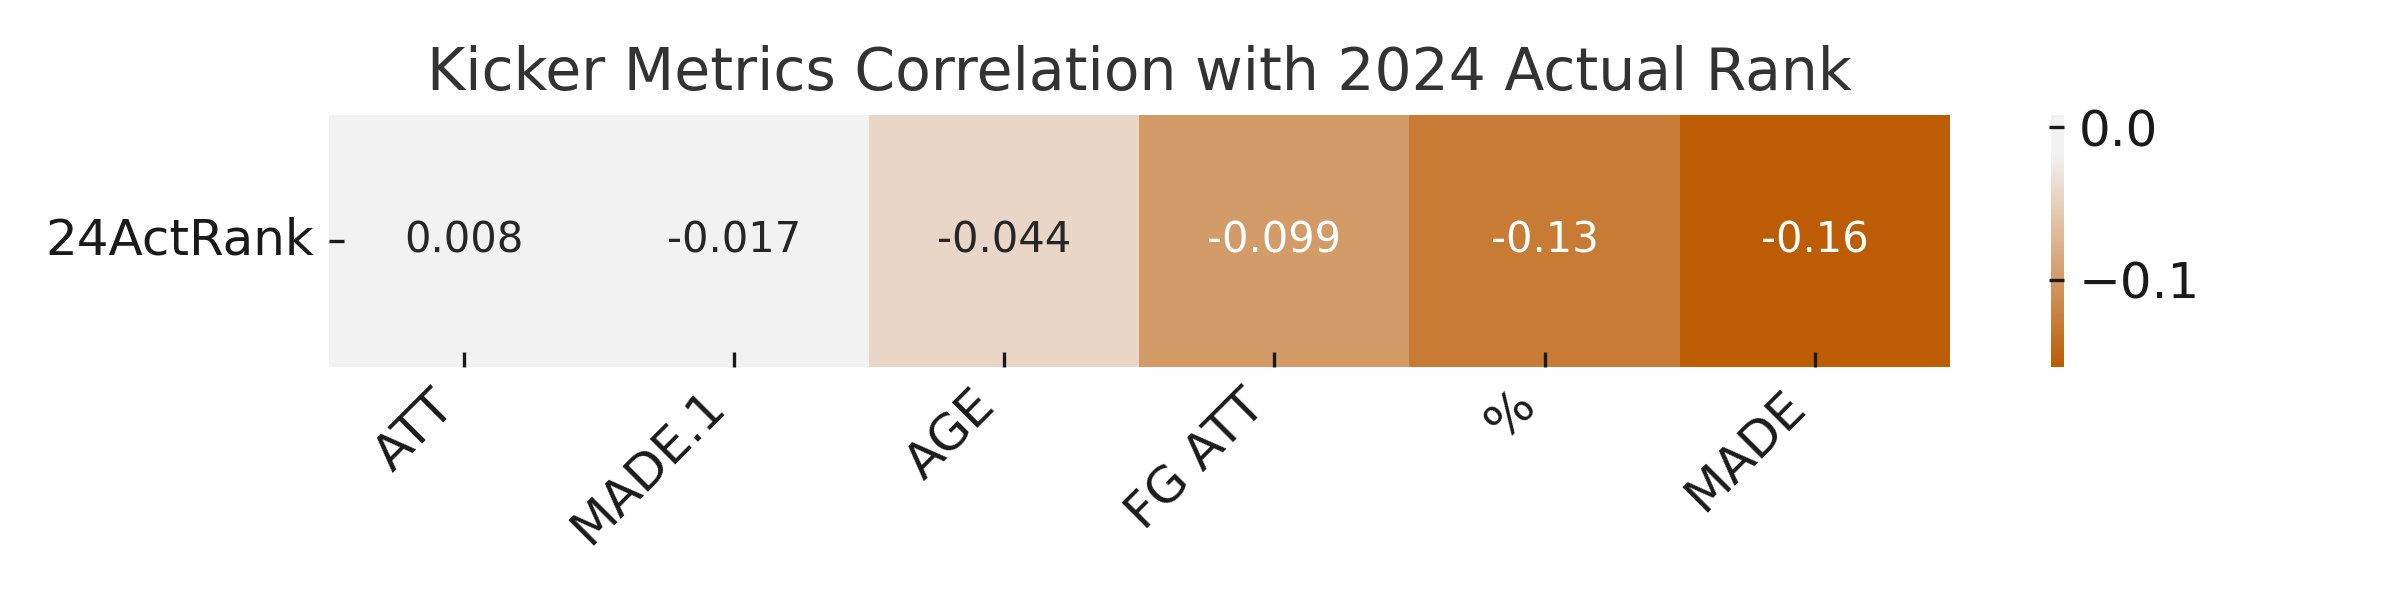
On kickers, the correlation numbers tell the whole sad story. In statistics, a correlation of 1.0 means two variables move in perfect lockstep, 0.0 means there’s no relationship at all, and negative numbers mean they move in opposite directions. In fantasy football terms, anything above about 0.6 would be considered a strong, actionable signal; 0.3–0.5 might be moderately useful, and anything under 0.2 is barely better than rolling dice.
Kickers didn’t even sniff “moderately useful.” Field goal attempts, the one stat you might expect to have at least some predictive bite, was essentially zero, meaning it had no measurable relationship with who finished at the top. The rest: makes, percentage, extra points, were also useless. If you’re hoping to find a preseason metric that reliably points to a top-five kicker, this dataset says stop looking. There is no substantive predictive relationship to lean on.
Defenses were only marginally better, and still not in a way that would help on draft day. The “positive” correlations were negligible, well below any threshold you’d trust for lineup decisions. The only real takeaway was about inflation, not prediction: preseason models seem to overweight sacks and quarterback hits, which can artificially boost certain defenses in preseason rankings. Ironically, those inflated teams often underperform once the season starts. If I’m breaking a tie between two similarly ranked defenses, I’d actually prefer the one with lower projected sacks and QB hits, because that profile was less likely to be overhyped by projection noise.
Bottom line: for both positions, the decimal correlation values are so low they’re effectively telling you, “Don’t bother.” For kickers, there’s no signal at all; for defenses, the best you can do is avoid getting tricked by the illusion of pass-rush projections that rarely translate into consistent fantasy scoring.
Draft Strategy Implications
The data makes this simple: don’t burn premium draft capital on kickers or defenses. In standard scoring leagues, they belong in the final rounds, period. By then, the remaining skill players are lottery tickets anyway, so using those picks to fill volatile spots comes with minimal opportunity cost.
The correlation numbers make the reasoning obvious. For kickers, the “top tier” and the middle of the pack are separated by such tiny, unreliable gaps that you might as well flip a coin. For defenses, the chaos is even worse, where those projected outside the top 20 have finished top three, and preseason favorites have imploded into waiver-wire fodder. That’s not bad luck, it’s proof that preseason rankings have almost no long-term predictive power here.
My approach is to load my bench with upside running backs and wide receivers in the middle and late rounds, then take whichever kicker and defense fall to me at the very end. From there, I ignore season-long projections entirely and focus on immediate, exploitable matchups, defenses facing turnover-prone quarterbacks, or kickers starting in favorable weather.
The real edge comes from flexibility. By streaming these positions weekly, targeting the best available matchups rather than locking into one “name”, you sidestep the volatility, dodge wasted draft picks, and quietly turn two of the least predictable roster spots into consistent point contributors.
Please note that if you’re looking for articles on Talent Strategy, those are now going to be posted at TalStrat.com. THANKS!