

PART 2: Exposing Anchoring Bias in ChatGPT and Its Inevitable Choice of Jordan as the GOAT
People Analytics


By: Scott Reida & Cole Napper

Source: Scott Reida (OpenAI-generated image)
This article is a continuation of Exposing Anchoring Bias in ChatGPT and Its Inevitable Choice of Jordan as the GOAT. It will cover Technical & Practical Observations, Repeatability, Future Study Suggestions, and Appendices. Both articles are written to discuss: A people analytics lens on GenAI bias, prompt phrasing, and the unintended consequences of digital decisions. (Not to mention: Is Michael Jordan really the GOAT? Yes. We already settled that in Part 1)
Subscribe to both Scott’s FF Insights Substack and Cole's Directionally Correct newsletter to follow the complete series and access more insights on people analytics.
Technical & Practical Observations
While anchoring bias was the central focus of this study, the process of running 180 structured prompt tests through ChatGPT revealed a number of additional technical behaviors worth highlighting. These observations, while not the primary subject of the research, offer important context for understanding how GenAI systems operate in practical settings. They also underscore the broader point that these tools are not deterministic engines of logic, but probabilistic systems that occasionally introduce errors, inconsistencies, or unpredictable formatting. These technical quirks have direct implications for how such tools are used in real-world workflows, especially in environments that demand consistency, precision, and auditability.
One of the most frequent issues encountered was that the sum of the contribution weights across all 20 metrics did not always equal 100 percent, even though the prompt explicitly requested that the total weightings be constrained to that value. In some outputs, the model over-allocated or under-allocated the total, and this happened without any alert or flag. In an automated scoring context, this kind of defect could easily go unnoticed and introduce unintentional weighting distortions in the final analysis. In other cases, some metrics were omitted entirely from the output, particularly those that received a weight of zero. It’s unclear whether the model did this as a formatting choice or due to an internal inference that a weight of zero made the metric irrelevant to display. Either way, the result was an output that appeared incomplete when compared against the full set of provided data.
Another recurring behavior was the introduction of metrics that were not present in the original dataset. In several outputs, ChatGPT inserted terms like “Offensive BPM” or “Career Minutes,” which, while related to basketball analytics, were not part of the 20 predefined metrics supplied in the prompt. This suggests that the model occasionally defaults to patterns found in its training data when it lacks strong contextual anchors or when it interprets a task as generative rather than strictly replicative. For use cases that demand data integrity and repeatability, this kind of behavior presents a risk, particularly if users are unaware that hallucinated content has entered the analysis.
Inconsistencies in output formatting were also observed throughout the study. Some outputs presented weights as decimals, others as percentages. Occasionally, numbers were rounded inconsistently or provided with varying decimal precision. There were also instances where weights were expressed clearly, but their associated metric names were either omitted, abbreviated, or misspelled. While these issues were relatively minor, they point to the importance of downstream validation when using AI-generated content in structured analysis.
Several of these issues were manually corrected to preserve the integrity of the comparisons across test groups. For example, when the model output terms like “SPG (Steals per Game),” we mapped those back to the original “SPG” field in the dataset. In five cases, semantic equivalence between AI-generated terms and original metrics allowed for these corrections to be made without loss of fidelity. We also standardized formats by converting decimal-based weights to percentages where needed. A more humorous correction occurred during one of the test iterations when an output table included a metric labeled “vgfffffijn”, a result of CoCo the cat walking across the keyboard during prompt entry. Fortunately, the row’s value aligned closely with “PPG” (Points Per Game), and a manual correction was applied. CoCo remains under close supervision for the remainder of her AI research internship.
Beyond formatting and hallucinations, one concerning technical observation was that several of the provided metrics were not universally applicable to all players in the dataset due to historical gaps in data collection. For example, advanced metrics like SPG or BPG were unavailable or unreliable for players who competed in earlier eras. This created a temporal mismatch that may have distorted the fairness of evaluations, especially in prompts that did not attempt to account for era-specific limitations. It is a reminder that even with structured data, the underlying context of that data, its availability, consistency, and completeness, can influence AI-driven evaluations.
Together, these observations highlight the complexity of using GenAI tools for tasks involving structured analysis. While the model’s performance was generally consistent, it was not flawless, and small defects in data handling or output formatting could create larger issues in downstream decision-making environments. For individuals and organizations relying on these tools for talent evaluation, scoring models, or performance summaries, these findings reinforce the need for a layer of human review and validation. They also point to the value of prompt testing and iteration, not only to improve clarity but to expose hidden behaviors that might otherwise go unexamined in a production setting.
Repeatablity
In any experimental study, particularly those involving AI model behavior, repeatability is essential. Results must not only be statistically significant, but also stable and replicable under slight variations in conditions. With that in mind, and recognizing an earlier limitation in the original dataset, where some of the 20 selected NBA metrics were not applicable across all 20 players, a second iteration of the study was conducted. This refinement offered an opportunity to improve data relevance and further validate the consistency of the observed anchoring effect.
The revised version of the study narrowed the focus to a subset of 13 metrics selected from the original 20. These 13 were chosen for their consistency and applicability across all eras of NBA play, reducing the potential for distortion caused by missing or uneven data coverage. Figure 1 provides a side-by-side comparison of the metrics used in each study iteration.
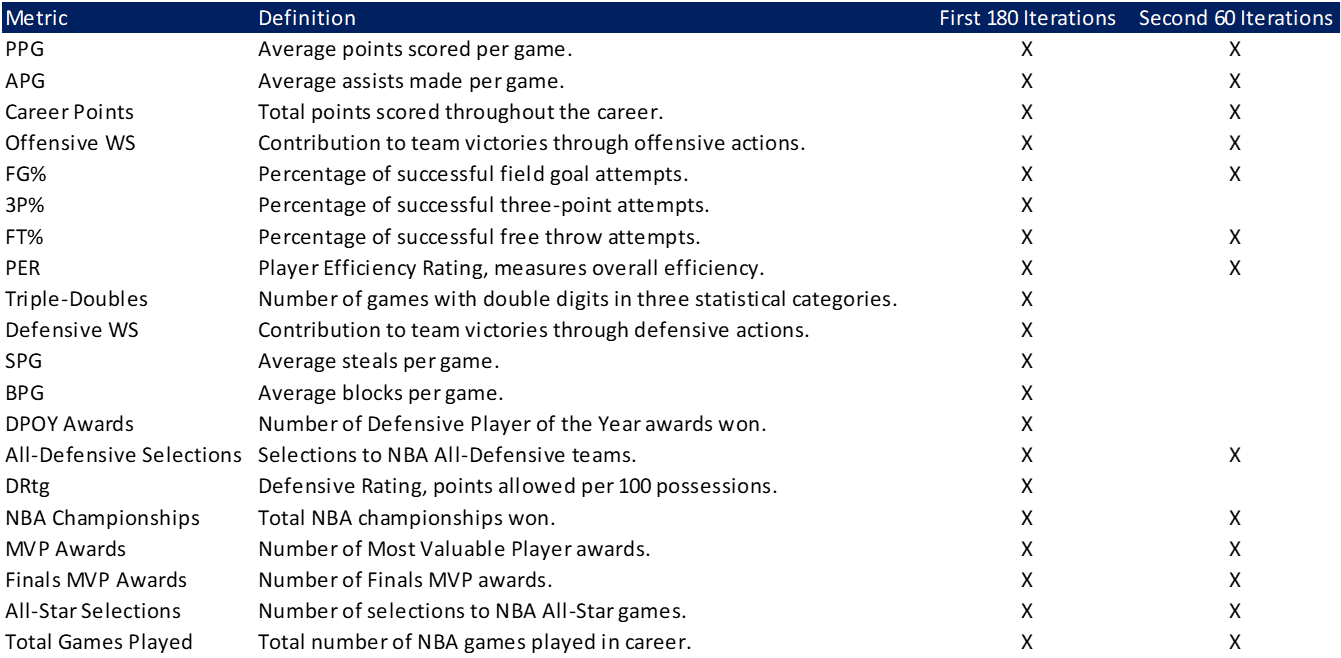
Figure 1: List of metrics used for each iteration of the study
Additionally, the player pool was expanded from 20 to 30 athletes, creating a broader and more representative sample for the model to analyze. To ensure uniform scaling across the new dataset, metric values were gathered using ChatGPT and then standardized using a simple yet rigorous method. Scores were scaled so that the average value across all players for each metric equaled 50 on a 100-point scale, with each standard deviation above or below the mean shifting the score by 15 points. For example, a player performing two standard deviations above the mean in a given metric would receive a score of 80.
With this revised dataset, a second test was conducted using the same anchoring framework as before, comparing a neutral control prompt to the same one containing a strong numerical anchor suggesting that Assists Per Game (APG) should account for 90 percent of the total weighting. As with the original design, each condition was tested in 30 independent iterations, and the resulting APG weights were extracted and analyzed using a two-sample t-test. The statistical results of the second study iteration mirrored the first in both direction and significance.
The control group showed a mean APG weight of 4.80, while the 90 percent anchor group averaged 6.70. The p-value for the difference between these means was 5.51 × 10⁻⁷, far below the commonly accepted 0.05 threshold for significance. Moreover, the effect size, measured using Cohen's D, was calculated at 1.51, representing a large and practically meaningful difference between the two groups. These findings reaffirm that even when using a new dataset, expanded player pool, and more carefully scaled metric values, the anchoring effect observed in the original study persisted.
The tests were done as 30 iterations of the Control and 30 iterations of the 90% anchoring scenario on APG. The resulting data for assists per game (APG) for each test scenario, results of the analysis, and histogram visualization are as follows:
Figure 2: Raw data of assists per game (APG) by scenario split by study iteration
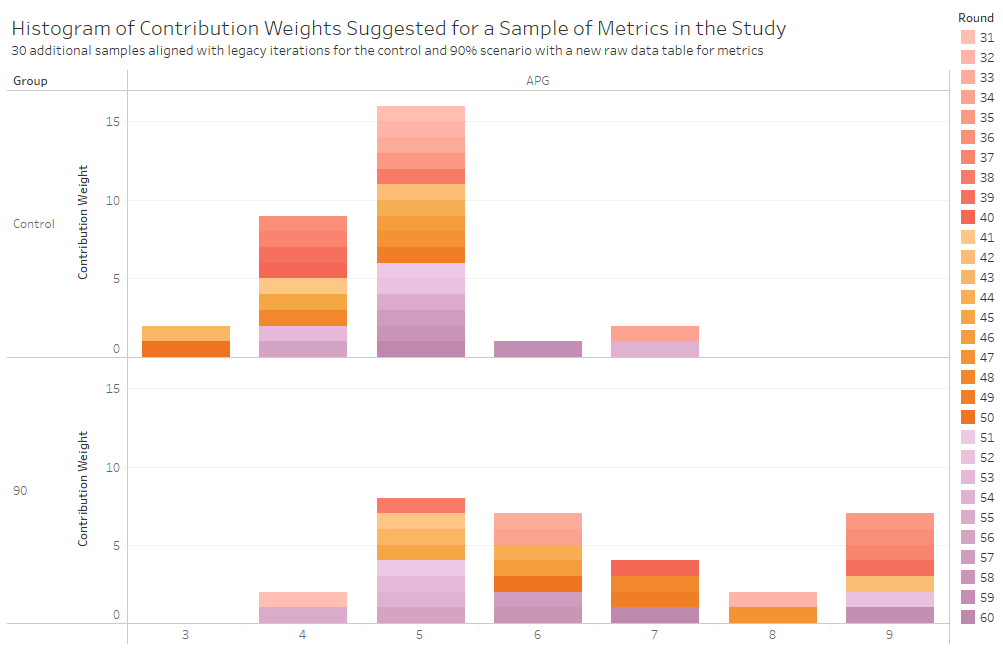
Figure 3: Histogram of test metric, assists per game (APG), for second iteration of the study (x-axis the suggested contribution weight as a percentage)
To further explore the implications of the revised dataset, the manually scaled 100-point metrics were also applied across all players in a combined evaluation, extending the methodology from the original study to a broader set of inputs. The players were then ranked using the contribution weights derived from the same scenario-based prompts, and their final rankings were segmented into tiers using the k-means clustering algorithm feature in Tableau.
In sum, this second iteration of the study not only addressed potential weaknesses in the initial dataset but also confirmed the robustness of the anchoring bias observed. It demonstrated that even when the conditions are altered for improved accuracy and coverage, the influence of a simple numerical suggestion in the prompt continues to significantly shape the model’s output. This kind of repeatability strengthens the case for further exploration, along with deeper scrutiny, of how GenAI systems interpret user intent through language.
Also provided in Part 1, the NBA player rankings are provided in Figure 4. Note that tiers, as provided in the view, were created using the k-means clustering algorithm in Tableau.
Figure 4: NBA rankings for Greatest of All Time (GOAT) per GenAI Anchoring Bias Study
Future Study Suggestions
While this study confirmed that anchoring bias can be triggered through prompt design in Generative AI systems, it also opened up several new lines of inquiry that deserve further exploration. The findings here should be viewed not as an endpoint but as a starting point for a broader investigation into how language influences algorithmic interpretation, particularly in systems that are increasingly being used to guide decisions across hiring, education, healthcare, and public policy.
One natural extension of this work would be to examine how other types of cognitive biases manifest within GenAI outputs. Anchoring is just one of many well-documented psychological phenomena that can affect judgment. Future research could test whether Generative AI is also susceptible to confirmation bias, framing effects, or primacy and recency effects, especially when prompts are written to highlight specific perspectives or precede conclusions with emotionally or politically loaded content. These dynamics are particularly relevant as AI is used to summarize documents, interpret trends, or make recommendations in real-time business scenarios.
Another area for deeper investigation is the impact of anchoring on variables beyond the one targeted. In our study, the APG metric was intentionally anchored, but it is plausible that other metrics shifted as a result, either due to the model's internal compensation logic or associative reasoning learned from training data. A follow-up study could focus on creating a correlation matrix across all metrics to evaluate how a prompt anchoring one variable might unintentionally reshape the weighting of others. This is especially important in people analytics, where attributes such as leadership, innovation, collaboration, and integrity often interrelate, and shifting one may distort the balance of the entire evaluation.
Replicating the study across different GenAI models and versions would also be worthwhile. As tools like Claude, Gemini, and LLaMA enter mainstream use and as OpenAI continues to release new versions of its GPT models, it is essential to know whether anchoring behavior is consistent across platforms or whether improvements in fine-tuning and alignment have mitigated the issue in newer builds. Even within the same vendor ecosystem, responses may differ between ChatGPT-4o and GPT-4.5, for example, and this variability needs to be tracked in real-world settings.
There is also an opportunity to extend this research into other domains. The sports-focused structure of this study could be easily adapted to evaluate decisions in corporate performance reviews, academic grading, sales forecasting, or marketing campaign prioritization. Each of these environments involves the assignment of a weighted value to variables, and each could be vulnerable to anchoring bias introduced through prompt construction. Comparing results across these contexts would help identify where GenAI is most vulnerable and where its outputs remain relatively stable.
Organizations may also benefit from developing internal frameworks to monitor prompt hygiene. Rather than relying on individual users to write neutral prompts intuitively, companies could invest in prompt design guidelines that help minimize unintended bias. Automated tools could be created to scan for suggestive language or extreme numerical inputs and alert users to the potential for anchoring before submission. These tools could function similarly to spell-checkers or accessibility scanners, surfacing a quiet, behind-the-scenes layer of quality control that most users would otherwise overlook.
In parallel, a study focused on user behavior could reveal how often individuals unknowingly introduce bias into their prompts. Observational research or user interviews could help uncover patterns in prompt phrasing, levels of specificity, or tendencies to lead with assumptions. Understanding how users interact with GenAI in live scenarios, particularly in evaluative or decision-support roles, would help researchers build tools and training programs that address the root behaviors that make anchoring possible in the first place.
Finally, further investigation should be done into how biased outputs propagate through larger systems. In enterprise environments, an AI-generated evaluation is rarely the final product. It is often integrated into dashboards, aggregated into scorecards, or presented in meetings where decisions are made. If that initial output was anchored by prompt language, and no checks were in place to identify or correct it, the bias can ripple outward, shaping compensation structures, promotion outcomes, and even organizational narratives about who is considered “ready” or “high potential.” Future studies should track this full life cycle, from prompt to decision, to better understand the systemic effects of AI-driven evaluation pipelines.
As AI becomes more integrated into how we assess people, make recommendations, and interpret data, these kinds of research efforts will be critical. The more we understand about how GenAI tools interpret prompts, and how those prompts reflect our own biases, the more responsibly and effectively we can integrate these technologies into our most important decisions.
//APPENDIX//
Appendix 1: Table of weightings for all metrics across all scenarios for the 180 iteration (first) study
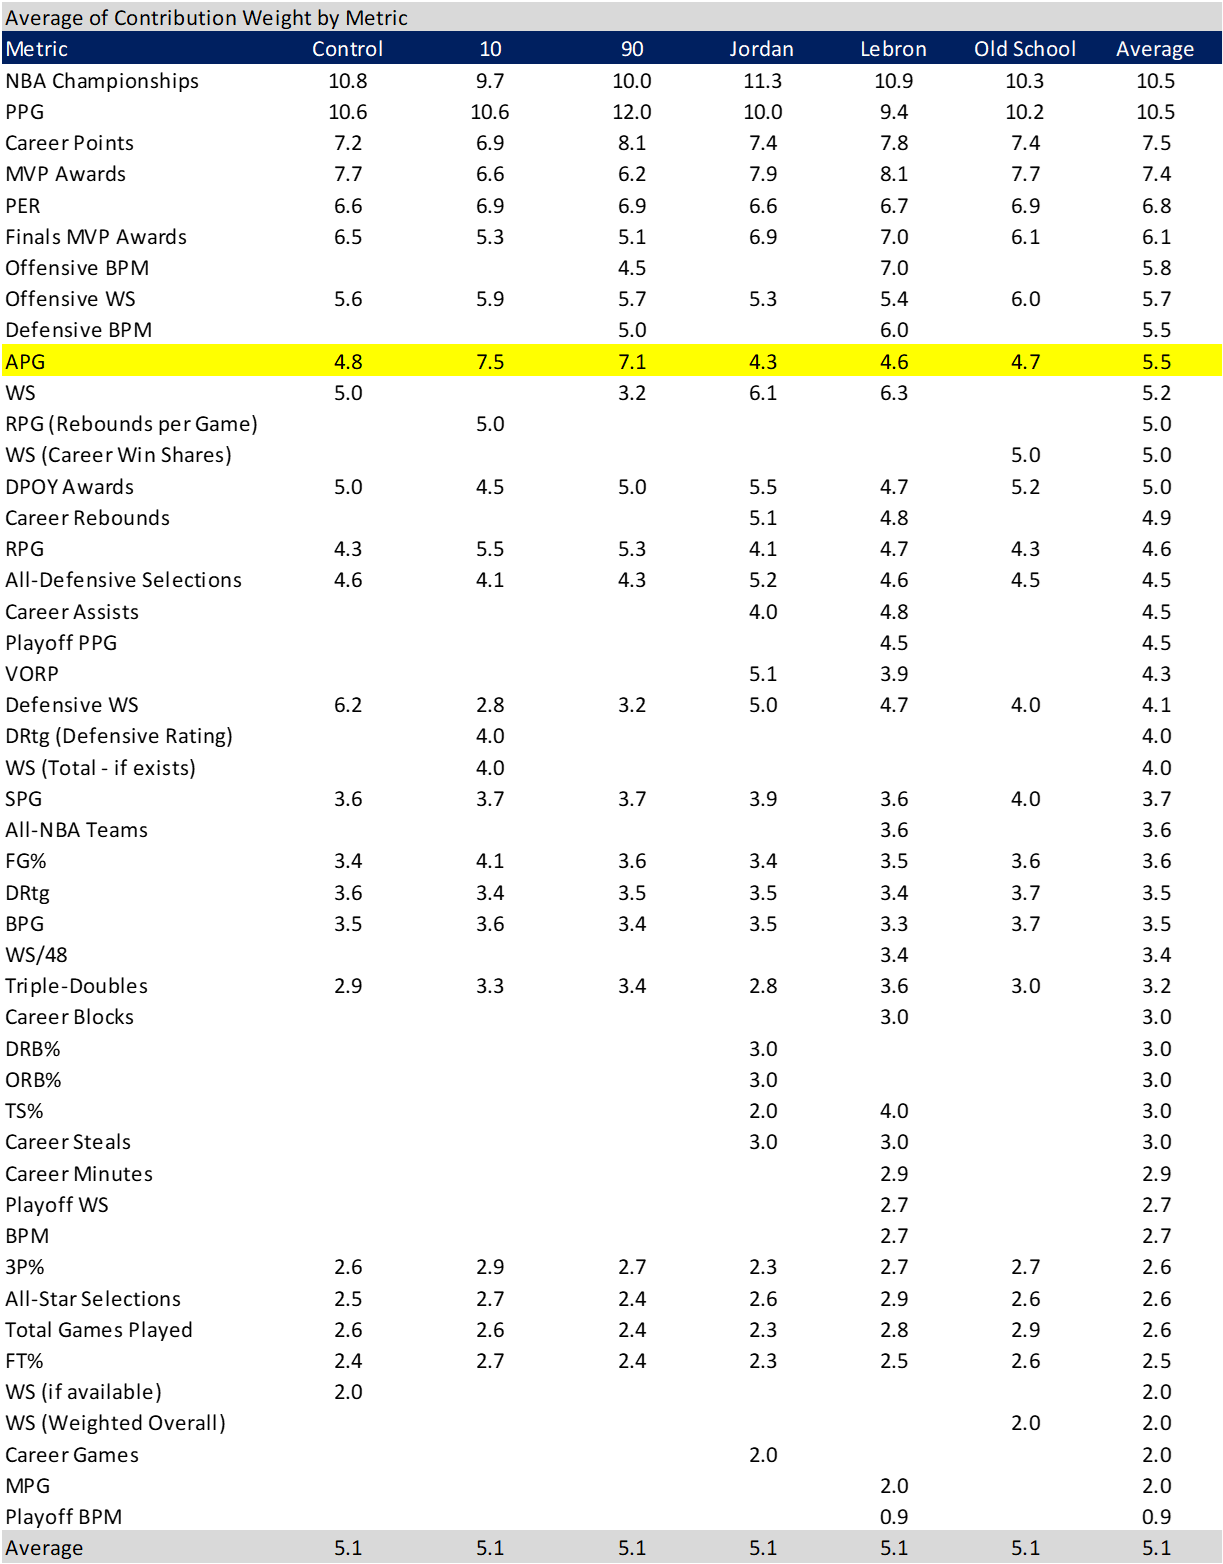
Appendix 2: Table of raw scores for all metrics in refined metric list used in second iteration of the study
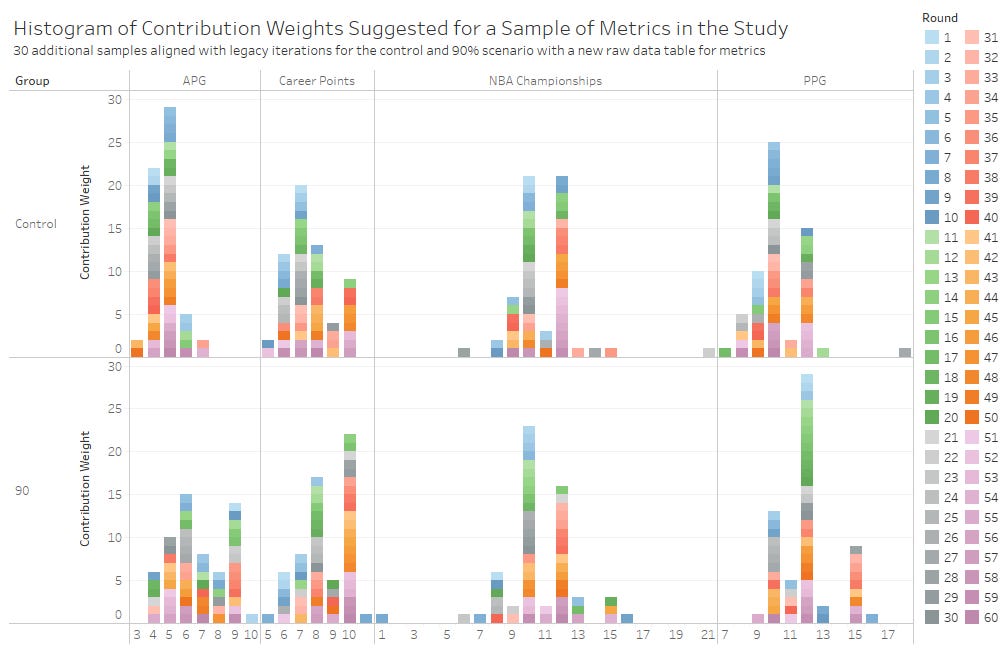
Appendix 3: Histogram of initial 180 iterations in first round of the study, along with subsequent 60 iterations (rounds 31 through 60)
Appendix 4: Verbatim prompts for the six scenarios used for the 180 iterations of the primary study, with anchoring language highlighted in each
Control
I am going to load a file (NBA_Metrics_Definitions.xlsx) that will define 20 metrics that are being used to evaluate 20 NBA players, who are provided in the attachment (Rounded_NBA_Players_Metrics.xlsx). The data in (Rounded_NBA_Players_Metrics.xlsx) is on a 100 point scale and is from low (0) to high (100) with the average at 50. This data is provided for every one of these 20 players across all 20 of the metrics. I want your help to weight all of these metrics to help me determine the best NBA player of all time. I want you to do this weighting based on what players, coaches, fans would emphasize (i.e., some of these metrics will naturally and should be, much more heavily weighted than others). I want you to provide the output as a table with columns for Metric and Contribution Weight of the Metric. The Contribution Weight should be rounded to one decimal place. Note that the sum of all Contribution Weights should sum to 100.0%. Please create the table now. You should return a table with only the two columns (Metric and Contribution Weight) and there will be 20 rows of data, along with the header.
90
I am going to load a file (NBA_Metrics_Definitions.xlsx) that will define 20 metrics that are being used to evaluate 20 NBA players, who are provided in the attachment (Rounded_NBA_Players_Metrics.xlsx). The data in (Rounded_NBA_Players_Metrics.xlsx) is on a 100 point scale and is from low (0) to high (100) with the average at 50. This data is provided for every one of these 20 players across all 20 of the metrics. I want your help to weight all of these metrics to help me determine the best NBA player of all time. For example, I would like for you to tell me that the overall contribution to the overall score for best NBA player of all time (which will be out of 100) for the metric of "APG" is 90.0% of the overall total. I want you to do this weighting based on what players, coaches, fans would emphasize (i.e., some of these metrics will naturally and should be, much more heavily weighted than others). I want you to provide the output as a table with columns for Metric and Contribution Weight of the Metric. The Contribution Weight should be rounded to one decimal place. Note that the sum of all Contribution Weights should sum to 100.0%. Please create the table now. You should return a table with only the two columns (Metric and Contribution Weight) and there will be 20 rows of data, along with the header.
10
I am going to load a file (NBA_Metrics_Definitions.xlsx) that will define 20 metrics that are being used to evaluate 20 NBA players, who are provided in the attachment (Rounded_NBA_Players_Metrics.xlsx). The data in (Rounded_NBA_Players_Metrics.xlsx) is on a 100 point scale and is from low (0) to high (100) with the average at 50. This data is provided for every one of these 20 players across all 20 of the metrics. I want your help to weight all of these metrics to help me determine the best NBA player of all time. For example, I would like for you to tell me that the overall contribution to the overall score for best NBA player of all time (which will be out of 100) for the metric of "APG" is 10.0% of the overall total. I want you to do this weighting based on what players, coaches, fans would emphasize (i.e., some of these metrics will naturally and should be, much more heavily weighted than others). I want you to provide the output as a table with columns for Metric and Contribution Weight of the Metric. The Contribution Weight should be rounded to one decimal place. Note that the sum of all Contribution Weights should sum to 100.0%. Please create the table now. You should return a table with only the two columns (Metric and Contribution Weight) and there will be 20 rows of data, along with the header.
Jordan
I need to prove to everyone once and for all that Michael Jordan is the GOAT! I am going to load a file (NBA_Metrics_Definitions.xlsx) that will define 20 metrics that are being used to evaluate 20 NBA players, who are provided in the attachment (Rounded_NBA_Players_Metrics.xlsx). The data in (Rounded_NBA_Players_Metrics.xlsx) is on a 100 point scale and is from low (0) to high (100) with the average at 50. This data is provided for every one of these 20 players across all 20 of the metrics. I want your help to weight all of these metrics to help me determine the best NBA player of all time. I want you to do this weighting based on what players, coaches, fans would emphasize (i.e., some of these metrics will naturally and should be, much more heavily weighted than others). I want you to provide the output as a table with columns for Metric and Contribution Weight of the Metric. The Contribution Weight should be rounded to one decimal place. Note that the sum of all Contribution Weights should sum to 100.0%. Please create the table now. You should return a table with only the two columns (Metric and Contribution Weight) and there will be 20 rows of data, along with the header.
Lebron
I need to prove to everyone once and for all that Lebron James is the GOAT! I am going to load a file (NBA_Metrics_Definitions.xlsx) that will define 20 metrics that are being used to evaluate 20 NBA players, who are provided in the attachment (Rounded_NBA_Players_Metrics.xlsx). The data in (Rounded_NBA_Players_Metrics.xlsx) is on a 100 point scale and is from low (0) to high (100) with the average at 50. This data is provided for every one of these 20 players across all 20 of the metrics. I want your help to weight all of these metrics to help me determine the best NBA player of all time. I want you to do this weighting based on what players, coaches, fans would emphasize (i.e., some of these metrics will naturally and should be, much more heavily weighted than others). I want you to provide the output as a table with columns for Metric and Contribution Weight of the Metric. The Contribution Weight should be rounded to one decimal place. Note that the sum of all Contribution Weights should sum to 100.0%. Please create the table now. You should return a table with only the two columns (Metric and Contribution Weight) and there will be 20 rows of data, along with the header.
Old School
I need to prove to everyone once and for all that the best NBA player of all time was playing in the early era of the NBA! I am going to load a file (NBA_Metrics_Definitions.xlsx) that will define 20 metrics that are being used to evaluate 20 NBA players, who are provided in the attachment (Rounded_NBA_Players_Metrics.xlsx). The data in (Rounded_NBA_Players_Metrics.xlsx) is on a 100 point scale and is from low (0) to high (100) with the average at 50. This data is provided for every one of these 20 players across all 20 of the metrics. I want your help to weight all of these metrics to help me determine the best NBA player of all time. I want you to do this weighting based on what players, coaches, fans would emphasize (i.e., some of these metrics will naturally and should be, much more heavily weighted than others). I want you to provide the output as a table with columns for Metric and Contribution Weight of the Metric. The Contribution Weight should be rounded to one decimal place. Note that the sum of all Contribution Weights should sum to 100.0%. Please create the table now. You should return a table with only the two columns (Metric and Contribution Weight) and there will be 20 rows of data, along with the header.
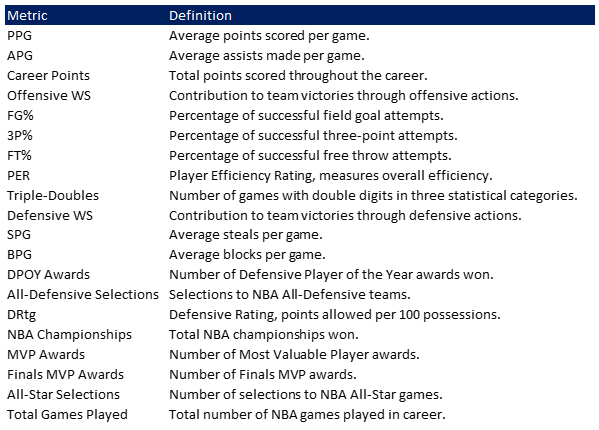
Appendix 5: Data Dictionary
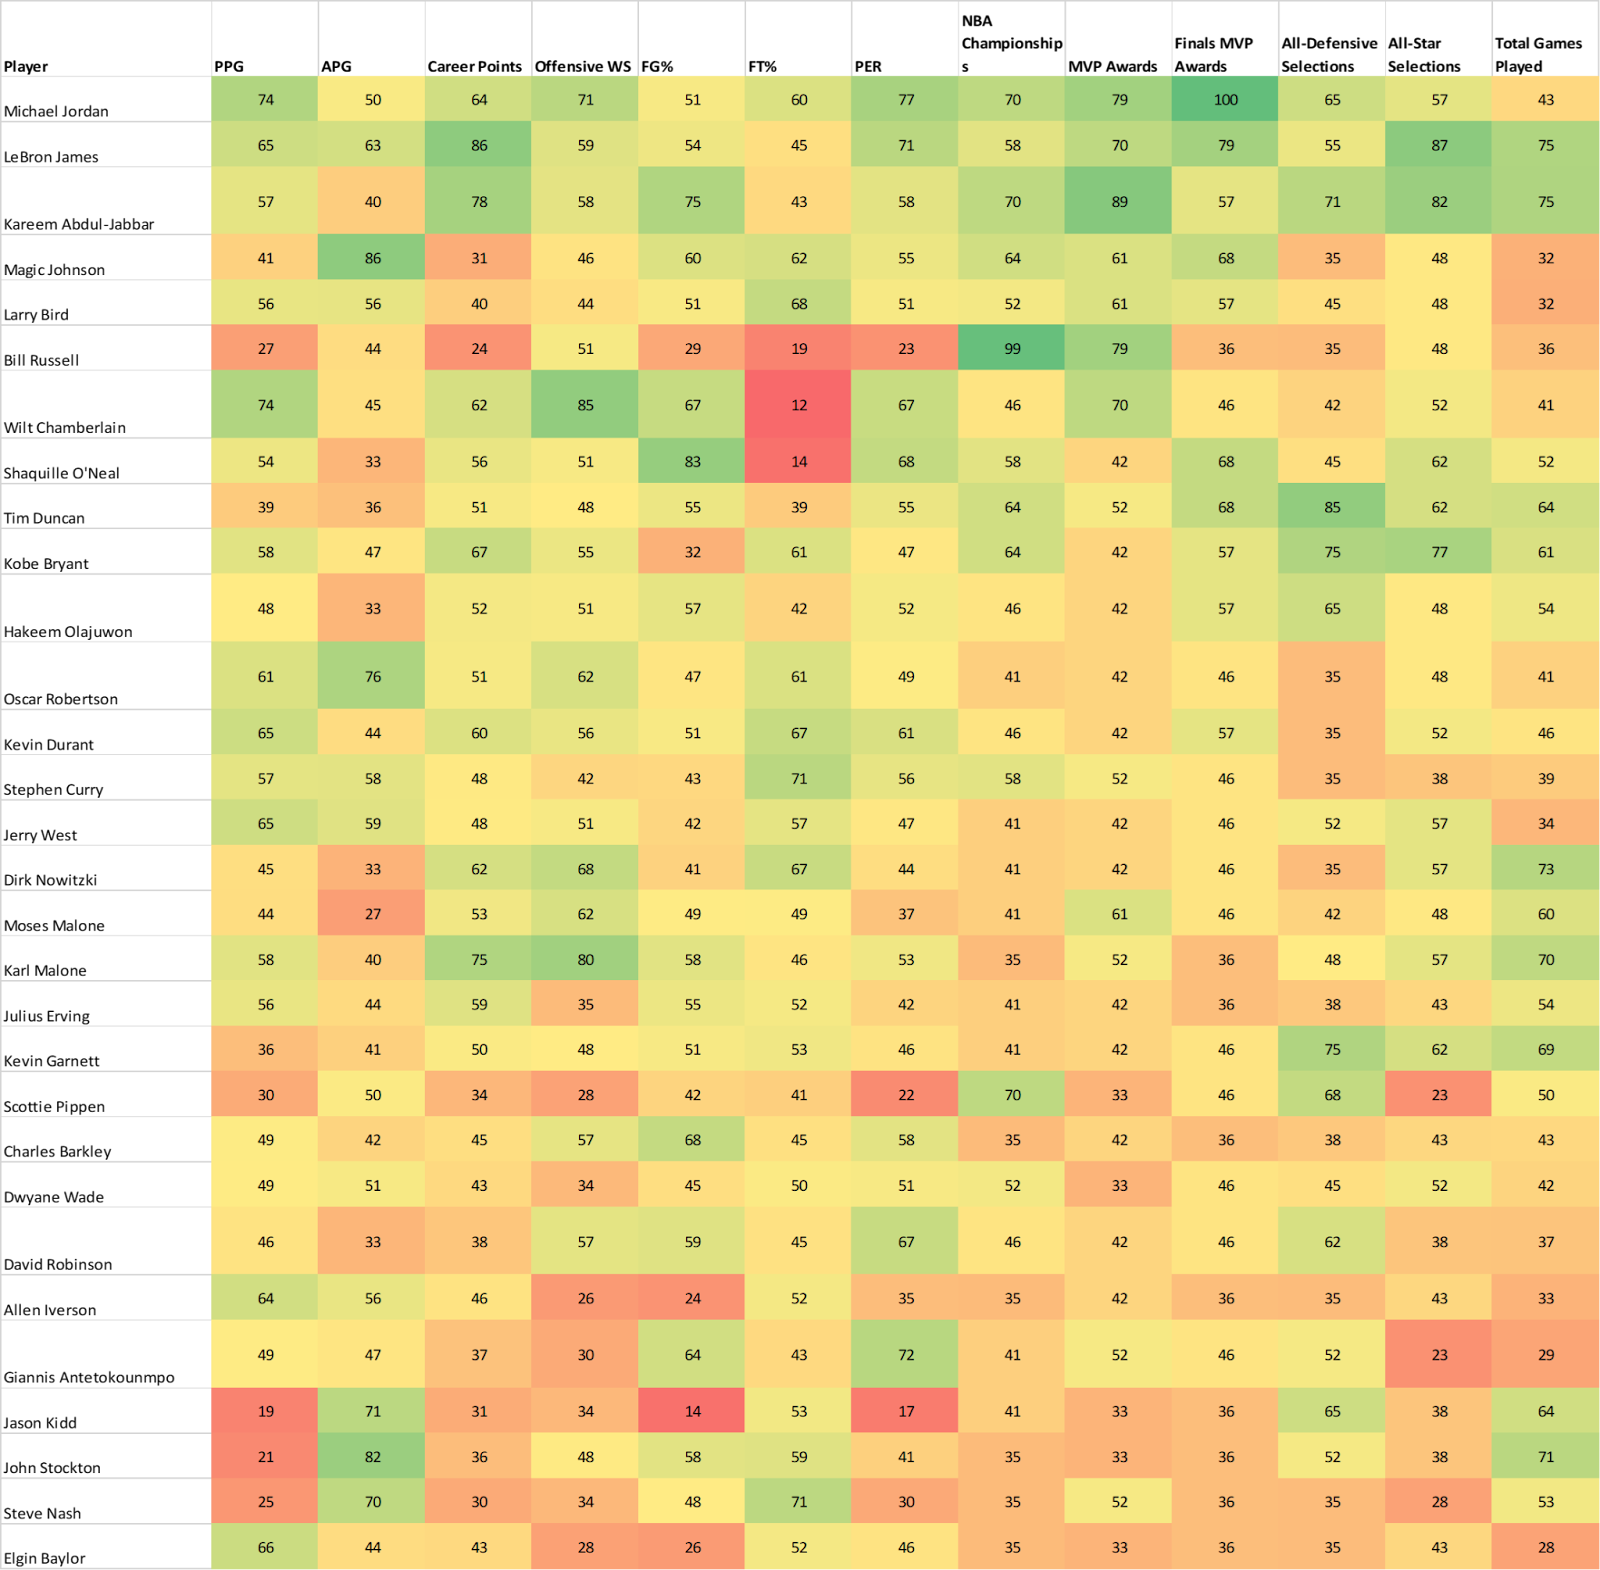
Appendix 6: Raw Data of Actual Metrics by Player

Appendix 7: Intermediate Step in ReScore: Average of Metrics
Appendix 8: Intermediate Step in ReScore: Standard Deviation of Metrics
Appendix 9: Intermediate Step in ReScore: Z-Scores

 | A guest post by
|