Drafting in the Dark: What the Data Says About Tight End Predictions
Lessons Learned


Intro / Context
Tight ends have always been the wild card of fantasy football, and the 2024 season was no exception. In a position group where usage patterns can swing wildly week to week and a single touchdown can vault a player up the rankings, predicting outcomes is notoriously difficult. For this analysis, I compared preseason Average Draft Position (ADP) to expert projections and then measured both against actual end-of-season finishes. The sample included the top 20 tight ends drafted in 2024, giving us a focused look at the players managers were counting on most.
What immediately stood out was just how volatile this position proved to be. Unlike wide receivers or running backs, where a larger sample tends to smooth out the extremes, the tight end pool is small enough that a few dramatic shifts can significantly alter the picture. This season’s results included swings so large that the player ranked 11th in preseason expectations ended the year as TE1, a leap that underlines just how fragile preseason assumptions can be.
The goal here is to understand not just how accurate preseason predictions were, but also whether there were any reliable signs of breakout or collapse hiding in the data. As with the other position analyses in this series, I’ll look at accuracy metrics, search for predictive clues in performance data, and distill these findings into practical draft-day strategies.
Volatility Snapshot
If I had to sum up tight ends in 2024 in one word, it would be “chaos.” In a group of only 20 players, the average miss for both ADP and projections was about seven spots. That’s a third of the entire pool. The high-end swings were especially wild, with Brock Bowers (TE11 in preseason) becoming TE1, while others ranked in the top five slipped into fringe relevance or dropped off entirely.
With so few players reliably producing week to week, even one or two outlier seasons completely reshaped the leaderboard. Unlike other positions, there wasn’t a middle tier you could bank on for stability. You were either riding a surprise breakout or trying to survive a bust.
Projections vs. ADP Accuracy
When I dug into the 2024 tight end data, it became clear that neither projections nor ADP had much of an edge. The rank correlations were almost identical: 0.276 for ADP and 0.274 for projections, showing that preseason expectations, no matter the source, struggled to line up with how the season actually unfolded. On average, the rankings missed by about seven spots out of a pool of only 20 players (MAE of 7.12 for ADP and 6.96 for projections). The variance told the same story: RMSE came in at 8.68 for ADP and 8.69 for projections.
To put that in perspective, the “average miss” here is roughly a third of the entire tight end pool. That’s a big whiff rate, and it means that even if you nailed a few players, the swings on the ones you missed were enough to wipe out any real advantage.
The takeaway for me is that tight ends in 2024 were simply volatile and hard to rank with precision. Whether I leaned on projections or draft position, the results weren’t significantly better than flipping a coin on who would overperform.
Searching for Predictive Clues
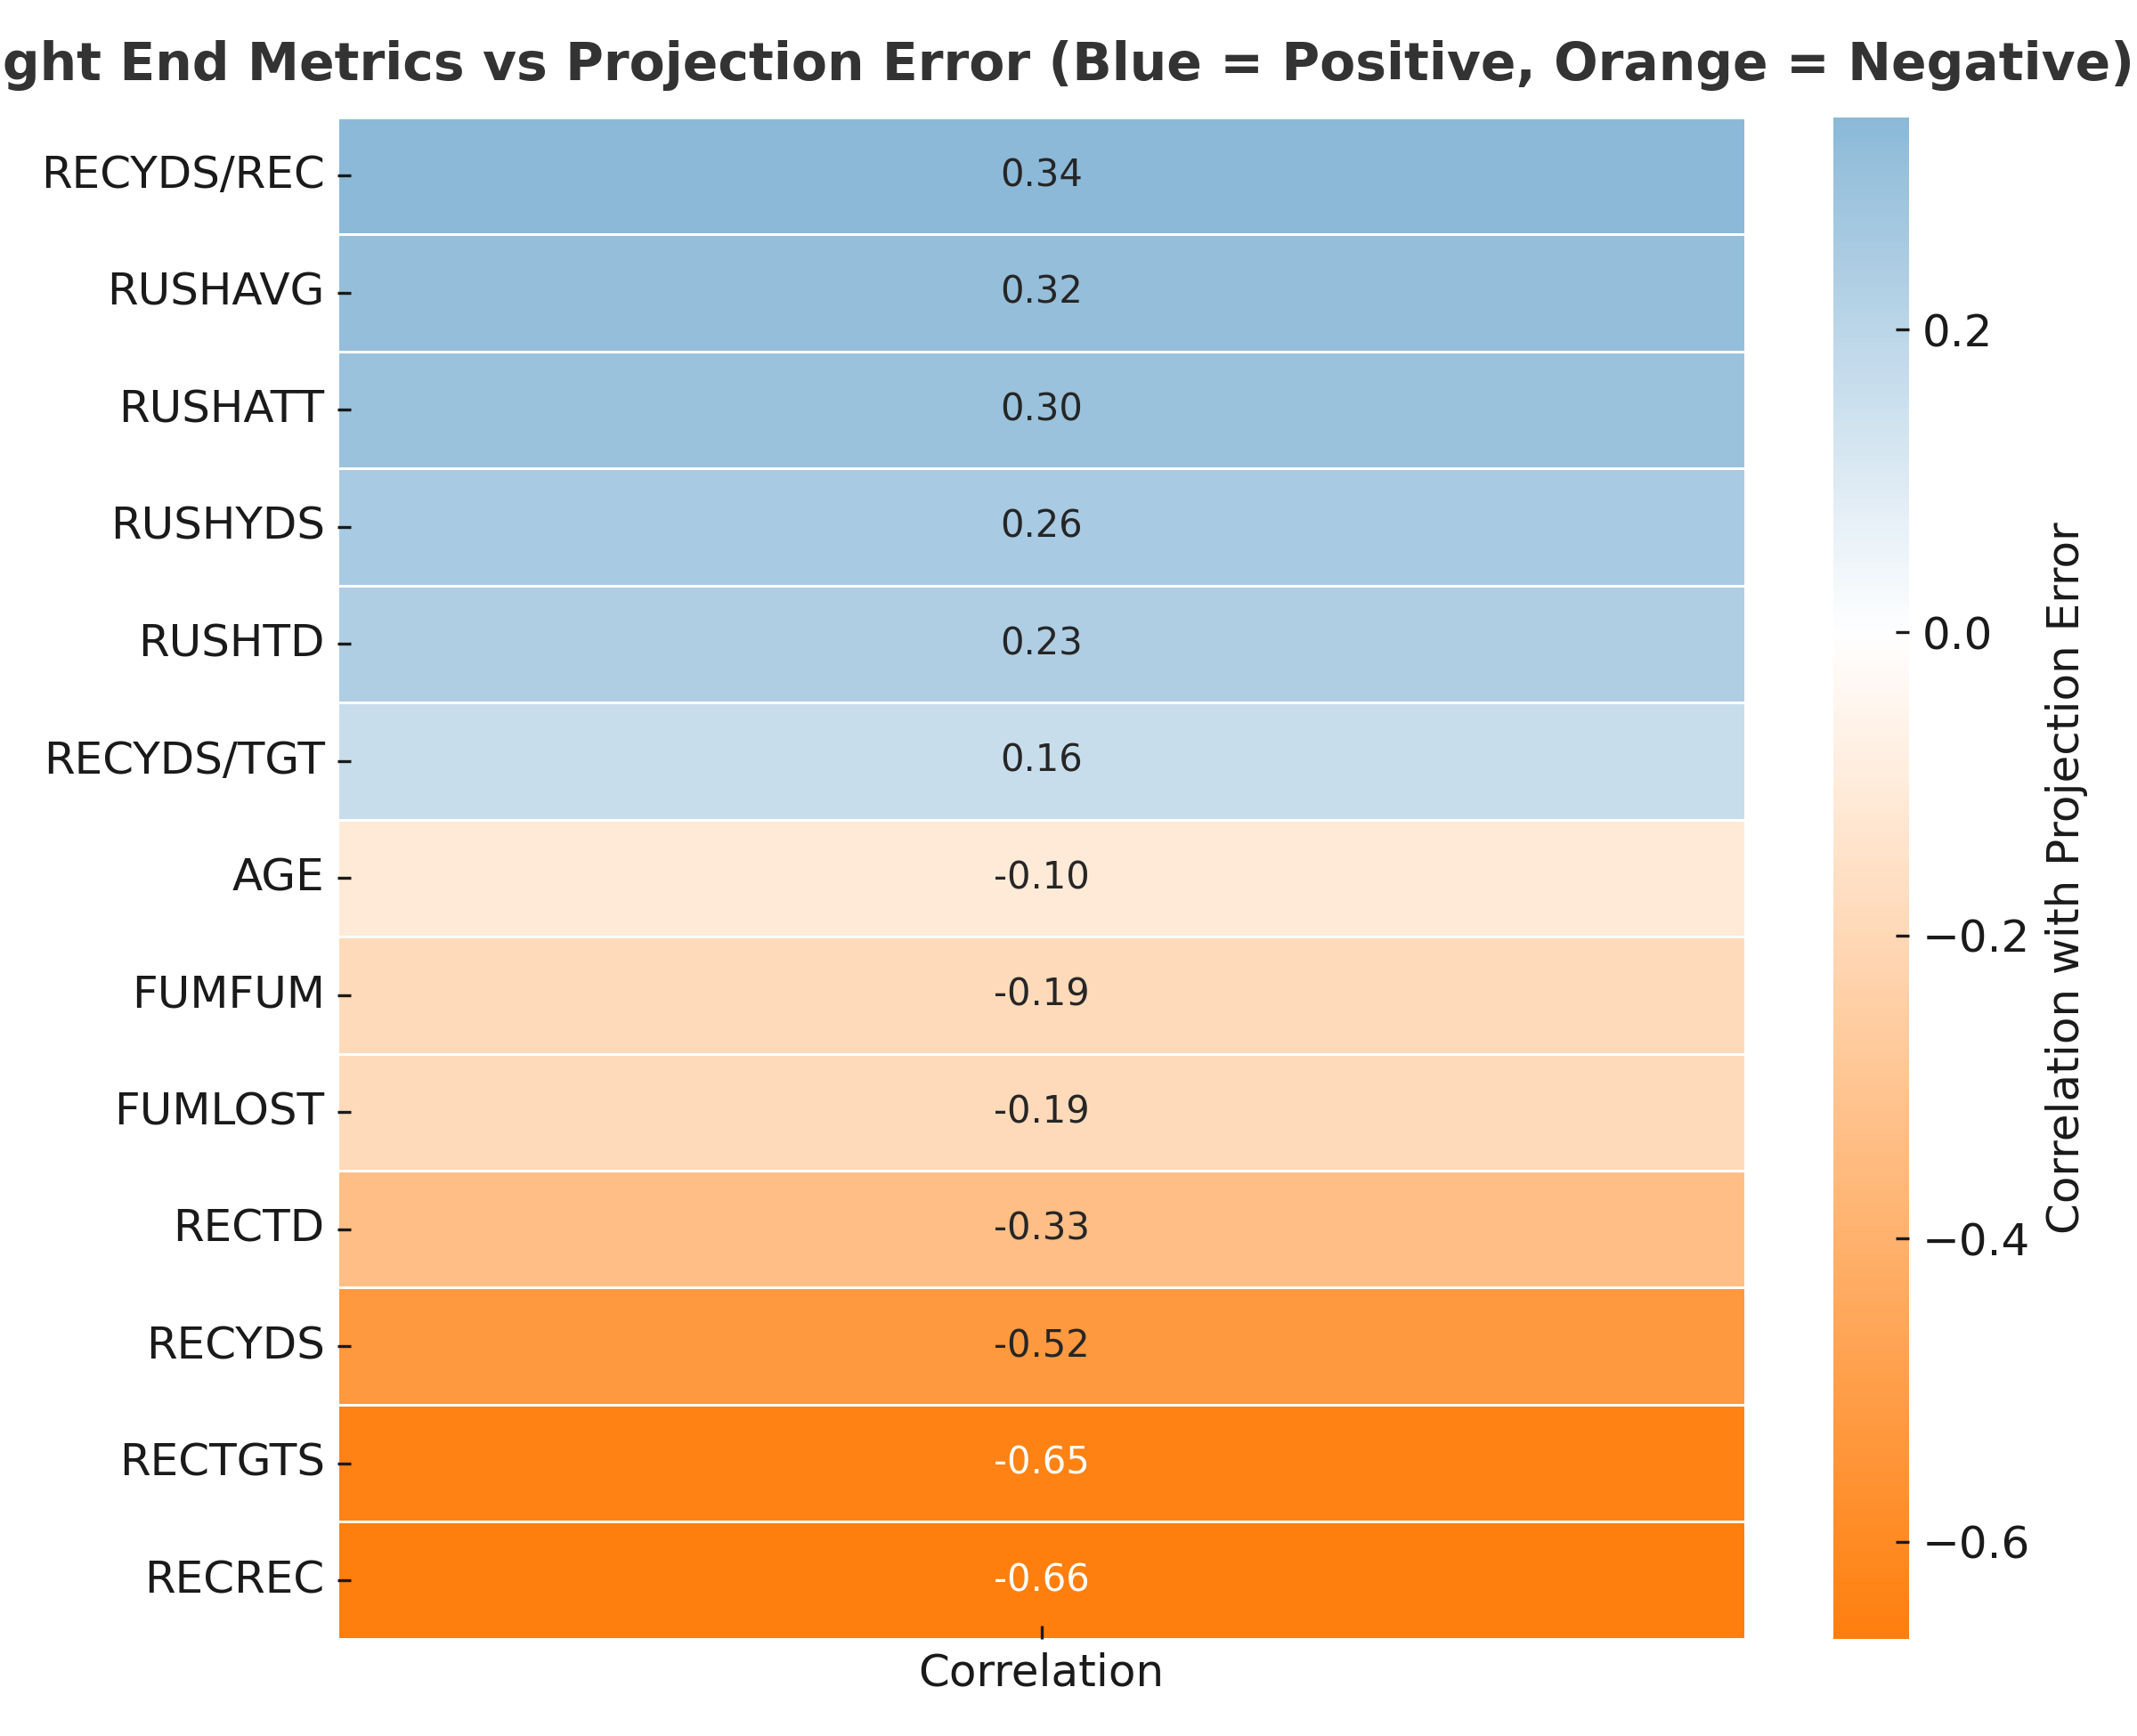
When I pulled up the heatmap for tight ends, the first takeaway was how little stood out. The overall accuracy for both projections and ADP was weak, and no single stat screamed “draft me.” Still, a few subtle patterns emerged that could offer a slight edge when choosing between two players with similar projected rankings.
Receiving yards per catch in the projection model showed the strongest positive relationship with actual performance. In practical terms, when two tight ends carried similar overall projection or ADP rankings, the one with higher projected receiving yardage tended to be the safer choice. Rushing attempts and rushing yards also leaned slightly positive, rare traits for the position, but a possible tiebreaker if present.
On the flip side, higher projected receptions and targets actually skewed negative, often signaling overestimation in the rankings. That’s a counterintuitive finding, suggesting that projection models may overestimate volume expectations without fully accounting for efficiency or scoring potential. Age landed near neutral, so there wasn’t a strong bias for or against older players in this group.
The lesson here isn’t that these clues will overhaul your draft board. They won’t. But in a sea of uncertainty, even small nudges can help to break a tie in your favor.
Draft Strategy Implications
For tight ends, the brutal truth is that neither ADP nor projection rankings offer much accuracy. Both methods produced nearly identical results, with average misses of about seven spots in rank and correlation scores that barely cleared 0.27. In other words, this is the least predictable position I’ve analyzed so far.
That doesn’t mean you’re drafting blind. But it does mean you need to adjust your expectations. The data suggests that when you’re stuck between two similarly ranked options, leaning toward the one with higher projected yards per catch is a slightly better bet. If a tight end brings any rushing usage, even in small doses, that’s an extra plus.
Equally important is knowing what to discount. Higher projected receptions and targets often misled, pointing toward players whose fantasy output fell short of expectations. In a position where misses are costly and streaming is common, avoiding these traps can matter just as much as chasing upside.
Ultimately, the strategy here is simple: accept the volatility, take small statistical edges when they appear, and don’t hesitate to pivot midseason if your choice isn’t producing. The numbers show that at tight end, flexibility is as much a weapon as draft-day foresight.
Please note that if you’re looking for articles on Talent Strategy, those are now going to be posted at www.talstrat.com. THANKS!